

Korea’s September export figures strengthen the case that AI investment is reaching suppliers beyond semiconductor makers. The clearest beneficiaries are storage devices and parts of the power-equipment supply chain. The expansion remains highly concentrated: chips and computers account for almost 90% of the increase in export receipts from a year earlier. For the economy, the important question is how much of this revenue becomes additional Korean production and spending.
The distinction matters ahead of the Bank of Korea’s third-quarter GDP release on 27 October. Its August forecast put Q3 growth at 2.6% year on year and 0.3% quarter on quarter. September’s exports add upside pressure to that benchmark, although the evidence on domestic activity remains uneven. [1, 5, 7]
Storage leads the gains beyond chips
September exports reached $120.94 billion, up 83.5% year on year. Using the revised monthly figures in the October release, Q3 exports totalled $318.42 billion, up 72.2%. The strength therefore extends across the quarter. [1]
The composition is more revealing than the headline. Semiconductors generated $43.67 billion of September’s $55.04 billion year-on-year increase. Computers added $5.69 billion, leaving $5.68 billion for everything else. These are calculations from the ministry’s category tables, shown in Figure 1. [1]
Figure 1 Sources of the September export increase
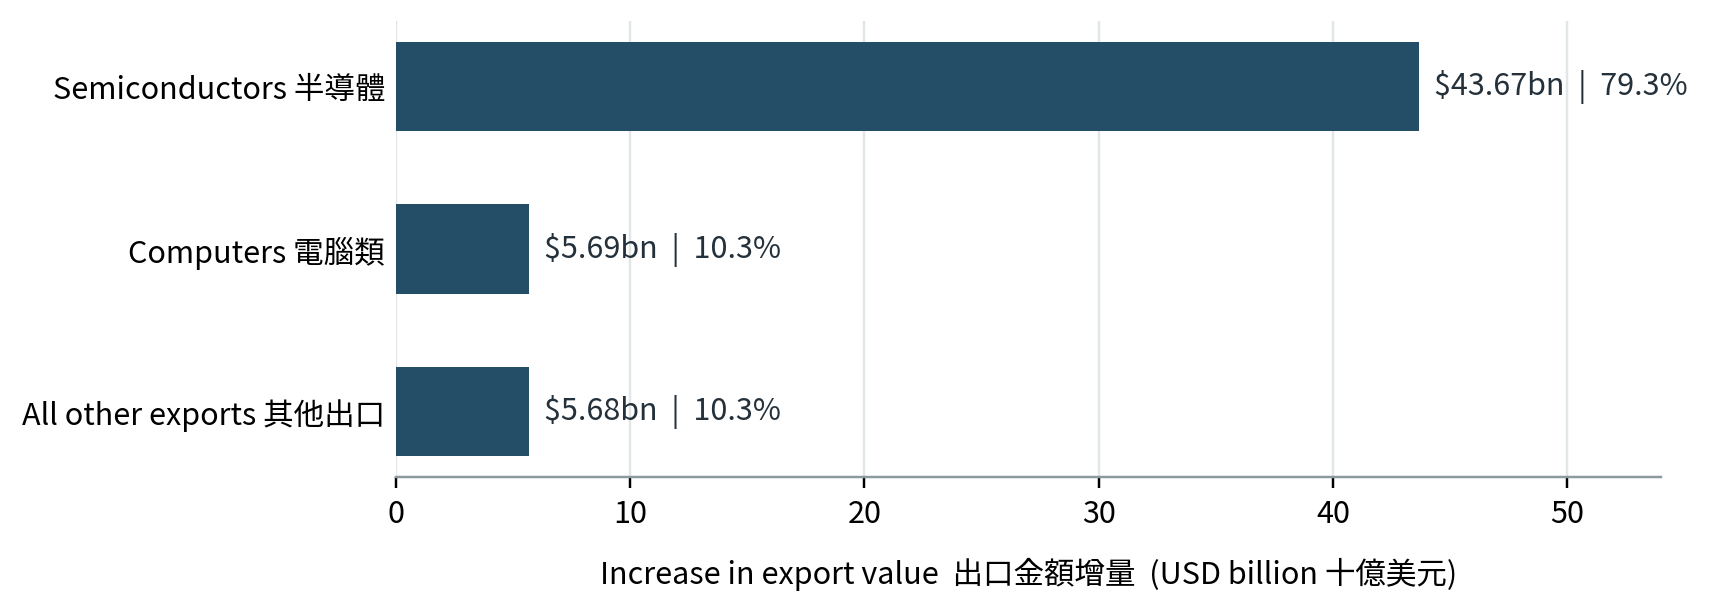
September 2026 versus September 2025. Labels show USD gains and shares of the $55.040bn total gain. Shares may not sum to 100% after rounding. Source: MOTIR, October 1 report, p.11; Azea calculations. [1]
The “computer” label can mislead readers picturing a consumer-PC recovery. Solid-state drives accounted for $6.77 billion of the category’s $7.00 billion exports, or 96.7%. Storage is therefore the main beneficiary within this category. It also explains why removing chips alone gives an expansive impression of the recovery: non-chip exports rose about 23%, whereas exports excluding both chips and computers rose about 12%. [1, 2]
Storage also benefits from an easier comparison. Computer and SSD exports fell 13.6% and 13.9%, respectively, in September 2025. Total exports and chips had already grown 12.6% and 22% that month. The overall surge thus builds on an already rising export base. [1]
Power equipment offers a smaller but more varied extension of the same demand. Electrical-equipment exports rose 23.4% to $1.83 billion, including products such as transformers, cables and circuit breakers. In its briefing, the ministry linked part of the demand to AI data centres and wider electricity-grid investment. These customers create opportunities outside chip fabrication, although the published figures do not separate AI-related orders from other grid spending. [1, 2]
The battery figures require more caution. Total secondary-battery exports rose 14%, but the report’s separately listed ESS lithium-ion battery line fell 7.1%. Rising aggregate battery receipts cannot establish that every storage segment is already benefiting. The clearer near-term evidence lies in SSDs and electrical equipment. [1]
Prices explain a large part of the revenue surge
The Bank of Korea’s August trade indices provide a useful check. Export value rose 75.8% year on year, while export volume increased 25.9%. The value-to-volume ratio implies a dollar export-price increase of about 39.6%. These indices have different coverage from customs totals, including the exclusion of ships, and cannot be substituted directly into GDP. They nevertheless show substantial real export-volume growth alongside a large price effect. [3]
September’s commodity exports show why this distinction changes the industrial story. Petroleum-product receipts rose 72%, even as export volume fell 6.9%; petrochemical receipts rose 5.1% while volume dropped 19.1%. Figure 2 puts these value and volume measures beside each other. Higher selling prices can improve revenue without requiring more domestic output. For industries buying those inputs, the same price rise can increase costs. [1]
Figure 2 Export value and volume growth
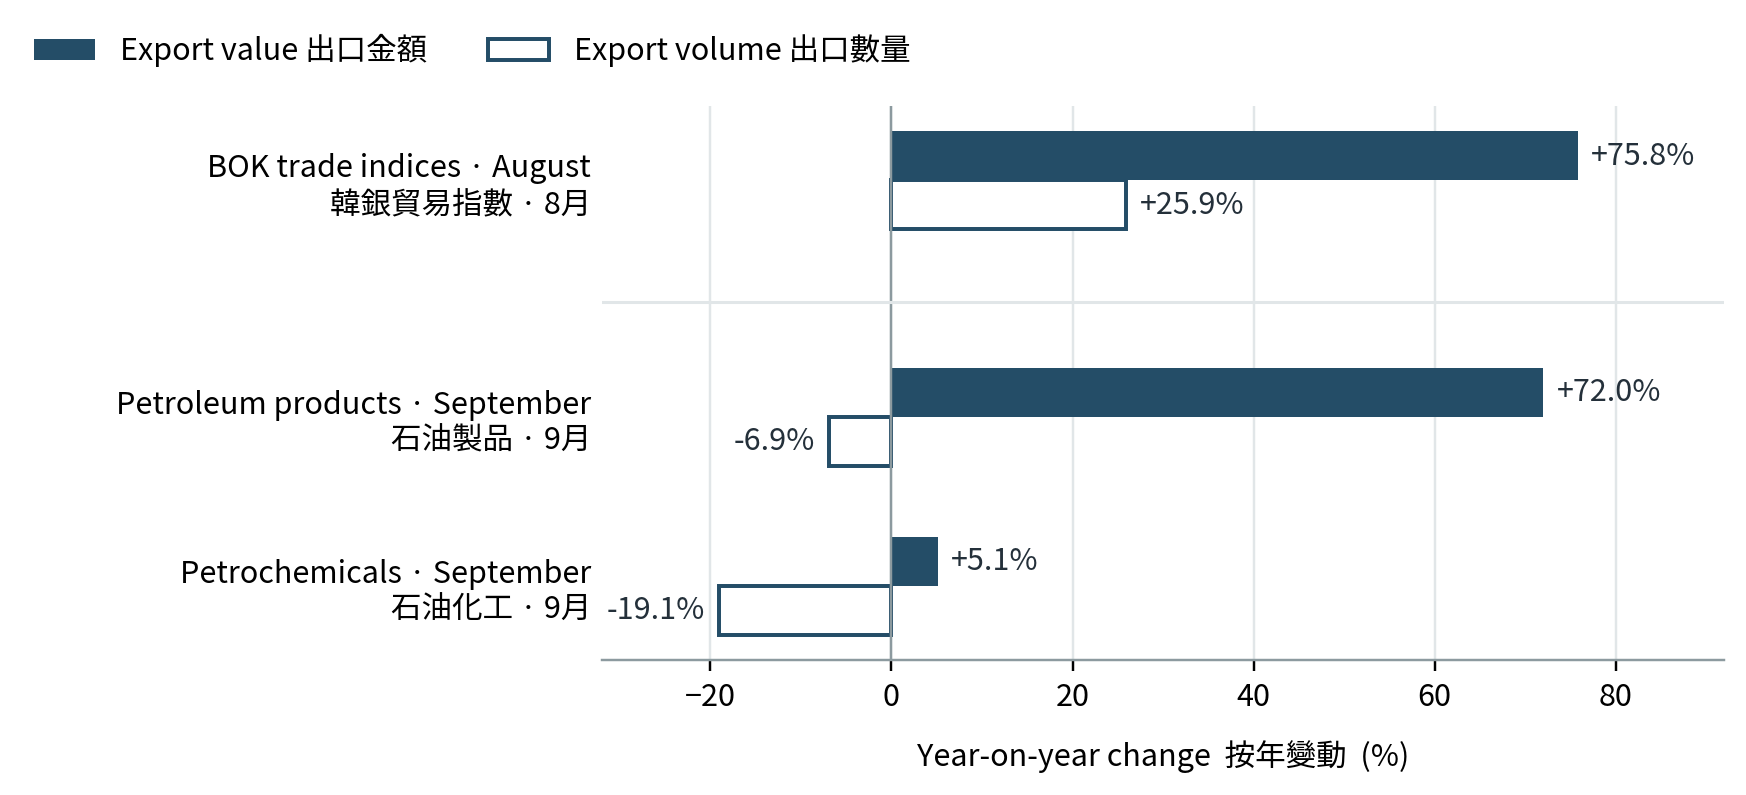
All comparisons are year on year. August uses the BOK’s price-adjusted trade indices, excluding ships and certain other goods. September uses MOTIR’s product value and volume changes. Compare each pair within its stated month and coverage. Sources: BOK and MOTIR. [1, 3]
Calendar effects complicate the comparison too. September had 21.5 working days, against 24 a year earlier, because Chuseok moved into September. Average daily exports rose 105%. Automobile exports, down 5.5% in the monthly total, were up 5.5% per working day. The holiday shift therefore obscures some underlying activity. But daily normalisation is imperfect across sectors: the ministry noted that chips continue to move by air over weekends and holidays. [1, 2]
The GDP effect depends on domestic value added
The trade release supports a stronger real-export outlook, but the domestic value added depends on what Korea produces and what it imports to support that production. September semiconductor-equipment imports rose 50.8% to $3.44 billion. Those purchases can expand future capacity; in the current GDP accounts, the imported portion of investment is offset by imports. Local construction, installation and related services are separate sources of Korean value added. A large equipment order therefore has a different immediate GDP effect from an equally large order fulfilled entirely at home. [1]
The latest Q2 national accounts illustrate the scale difference. Real exports of goods and services increased 8.9% year on year, and real GDP grew 3.7%. Quarter on quarter, exports rose 1.3%, private consumption 0.4% and facilities investment 0.2%. Export revenue can move much faster than economy-wide real activity. [4]
August’s domestic data also limit a broad acceleration call. Retail sales fell 1.8% from July and equipment investment fell 9.5%; mining and manufacturing output declined 4.8%. Services output rose 0.5%, and construction completed increased 1.9%. These seasonally adjusted monthly changes are volatile and cover only part of Q3, but they show why the export report cannot settle the consumption and investment outlook. [6]
There is a base effect in GDP as well. Output rose 1.4% quarter on quarter in Q3 2025, creating a more demanding year-earlier comparison. Q3 2026 can record healthy sequential expansion while its year-on-year growth rate falls below Q2’s 3.7%. [4]
What would change the Q3 assessment
We see upside risk to the BOK’s 2.6% year-on-year Q3 forecast. A fresh point estimate would require the quarter’s real export and import data, inventories and domestic-demand components. The monthly export report alone cannot supply them. The BOK’s 3.3% forecast applies to the full year. [5]
A result above 2.6%, accompanied by firmer domestic investment and consumption, would show a broader expansion. Establishing how much of it comes from AI demand would still require sector-level evidence. If growth stays near the forecast despite exceptional export receipts, the GDP breakdown, read alongside trade-price and import data, would help separate price-led revenue growth from real export gains and identify any offsets from imports, inventories or domestic demand.
Storage-device suppliers show the clearest adjacent export gains; electrical-equipment suppliers have a credible demand channel that extends beyond AI. The September figures give less support to treating the entire battery, auto or general-machinery sector as a common AI beneficiary. The Q3 advance GDP release on 27 October will show how this concentrated export strength fits into the wider economy. It is scheduled for 08:00 Korea time, or 07:00 in Macau. [7]
Sources and calculation notes
Evidence checked on 7 October 2026. Export values are nominal US dollars. GDP figures are real chained-volume measures. Year-on-year GDP rates use the original series; quarter-on-quarter rates are seasonally adjusted. Observed data, official forecasts and Azea’s assessment are identified separately in the text.
[1] MOTIR September 2026 export and import report | 2026-10-01
Full Korean report, printed pp. 11–15, 21 and 28.
[2] MOTIR September trade briefing and questions | 2026-10-01
[3] BOK August 2026 export and import price and trade indices | 2026-09-15
Korean report, printed pp. 7–8; English report trade-index tables.
[4] BOK Gross National Income Q2 2026 preliminary | 2026-09-08
PDF, printed pp. 1–4.
[5] BOK Economic Outlook August 2026 | 2026-08-27
Appendix 2, printed p. 12; physical PDF p. 15.
[6] Ministry of Data and Statistics August 2026 Industrial Activity | 2026-09-30
[7] BOK statistical release calendar | Calendar checked 2026-10-07
Calculation notes
Figure 1 uses exact USD-million inputs: total exports 120,944 − 65,904 = 55,040; chips 60,295 − 16,621 = 43,674; computers 6,997 − 1,307 = 5,690; all other products 55,040 − 43,674 − 5,690 = 5,676. Chips plus computers contribute 89.6875% of the increase. SSDs are included within computers: 6,767 ÷ 6,997 = 96.7129%. Published quarterly totals are used because rounded monthly values can differ by $1m.
The August value-to-volume ratio gives implied export-price growth of (1.758 ÷ 1.259 − 1) × 100 ≈ 39.6%. The Korean BOK release also reports 39.6% for customs-time-lag-adjusted export prices. This differs from its headline KRW and contract-currency price indices. September commodity-volume measures and August BOK indices should not be combined into a single GDP forecast.